

Key Takeaways
- Track clicks, orders, and repeat purchases to see what shoppers do after opening emails.
- When clicks stay the same, but orders fall, check product pages and mobile checkout.
- Compare revenue per recipient across campaigns, then check what’s left after discounts and returns.
- Give first-time buyers the same amount of time to reorder before comparing groups.
- Send refill reminders based on when customers usually run out of the product.
- Judge win-back emails by how many inactive customers place another order.
A thousand people joined your email list last month, but only a few customers came back to buy again. More people visited your store, and first orders increased, so why did so few buyers place a second order?
Imagine your skincare store sends the same sale email to new subscribers, recent buyers, and customers due for refills. Plenty of people click, but many leave the product page without adding anything to their carts.
Some bought a bottle last week and still have plenty left by the time your email arrives. Others are ready to reorder, but the promotion sends them to a starter kit instead of their refill.
An email open alone tells you little about what a shopper does next. Clicks show that an offer caught their attention, while order history helps you understand what each customer needs. These ecommerce email marketing strategies show how to plan emails around customer buying habits.
This guide covers ten key metrics that help you understand how customers interact with your emails, make purchases, and return for another order. It also explains how to calculate each metric and use the results to decide which campaigns need changes, which are worth repeating, and which should be paused.
What Are Customer Engagement Metrics?
Customer engagement metrics show how shoppers interact with your online store and emails before and after they buy. A shopper might visit a product page several times to compare prices, then return later to place an order. Tracking those actions helps you see what draws interest and what brings shoppers back to buy again.
Choose what to track based on what you want to learn about a campaign or group of customers. For a product email, check how many people clicked and how many placed an order later that week. After a first purchase, track how many buyers order again within the time they usually need to reorder.
Why Customer Engagement Metrics Matter for Ecommerce Businesses
Traffic and sales can rise together for months while fewer customers return, especially when paid campaigns bring in new shoppers. Looking at ecommerce customer engagement metrics helps you see where those shoppers go after the first visit or order.
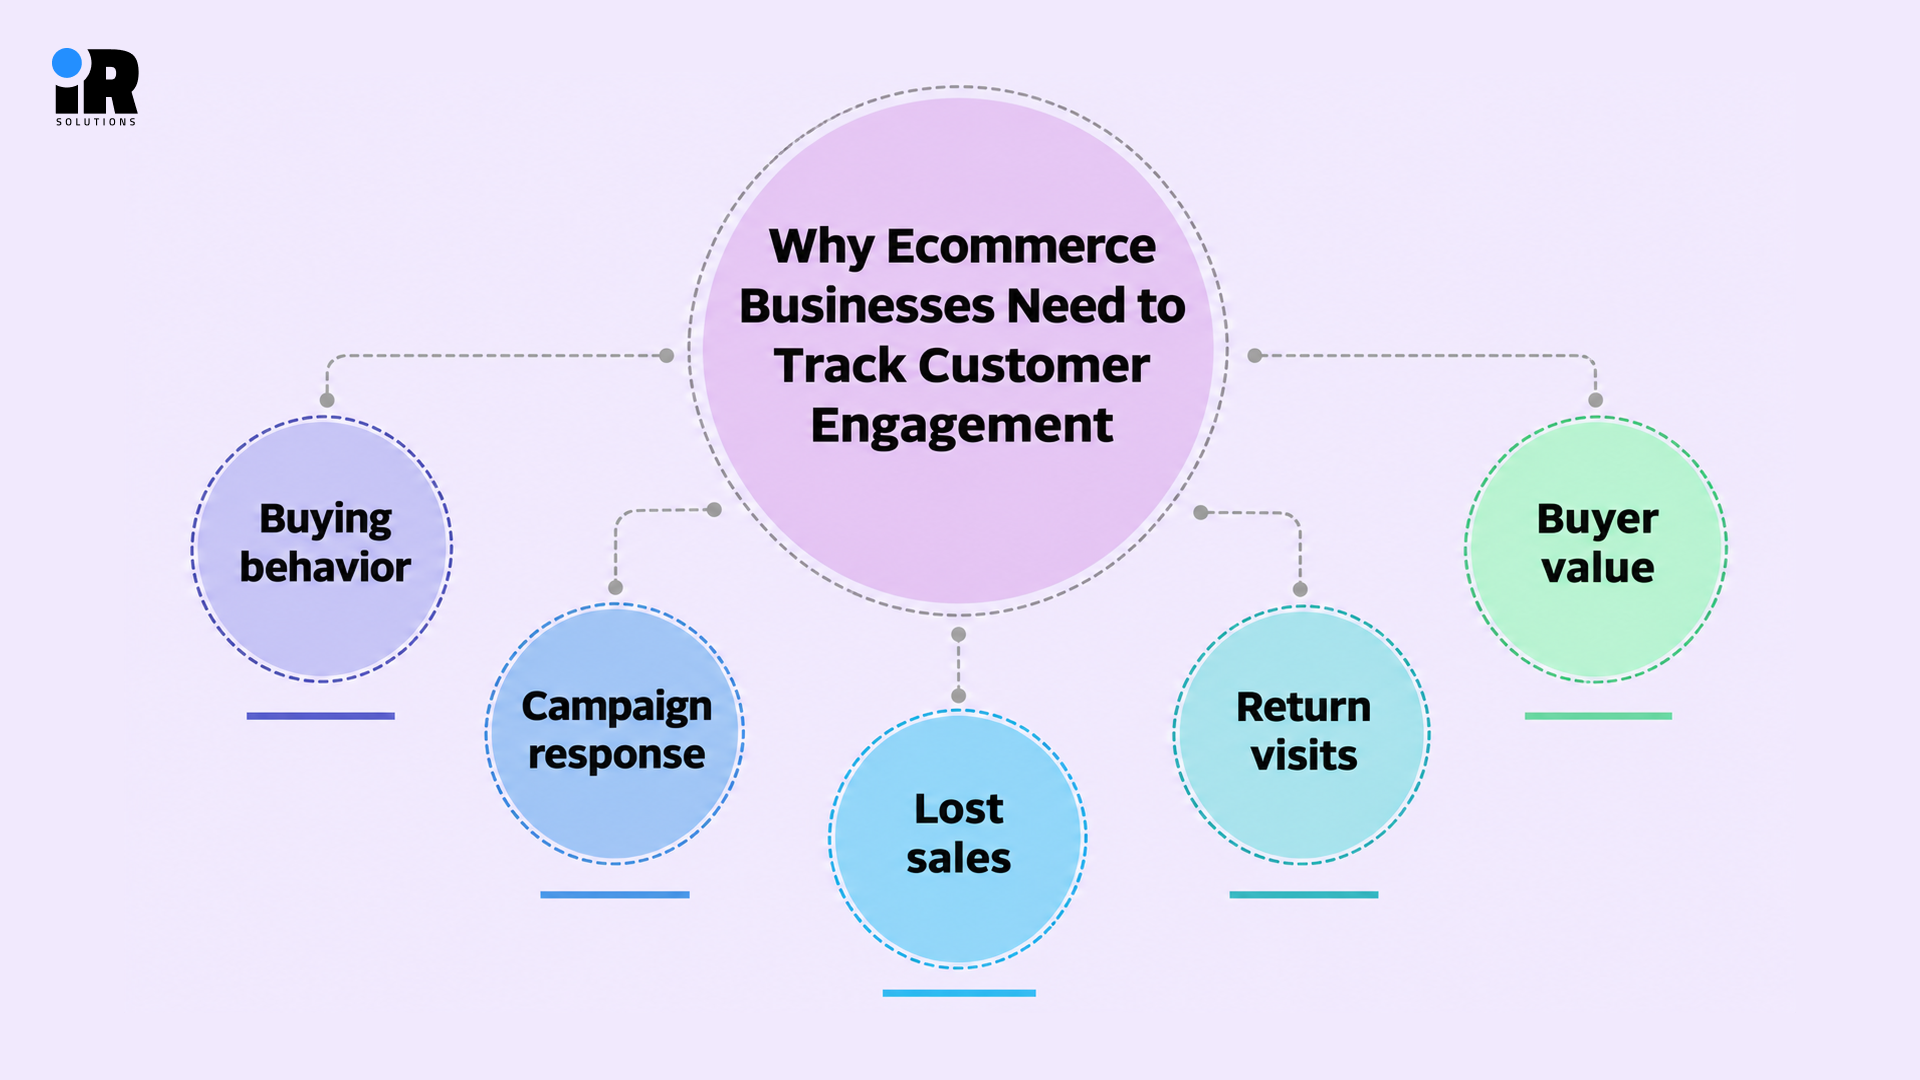
- Buying behavior: See which products and pages shoppers revisit before placing an order.
- Campaign response: Compare how new subscribers and regular buyers respond to the same email.
- Lost sales: Find where shoppers leave, such as when shipping costs appear at checkout.
- Return visits: See how many first-time buyers come back to place another order.
- Buyer value: Track how often customers buy and how much they spend over time.
Top 10 Customer Engagement Metrics to Track
Use email, purchase, and customer retention metrics together to follow shoppers from their first click to their next order. The examples below use illustrative figures, so you can substitute numbers from your own store and check each calculation. Record the date range and who counted in each group before comparing campaigns, products, or months.
1. Email Click-Through Rate (CTR)
CTR shows what share of people who received your email clicked a link, counting each person once. If 300 people click a campaign delivered to 10,000 recipients, your click-through rate is 3% for that send.
Formula · (Unique recipients who clicked ÷ Delivered emails) × 100
Apple Mail Privacy Protection can make opens harder to read, so check which links shoppers clicked to see what caught their attention. If the size guide gets more clicks than the product button, try putting key measurements in the email.
2. Email Conversion Rate
This rate shows what share of people who received your email completed an action, such as placing an order. If 40 of 8,000 recipients make a purchase credited to the campaign, the rate is 0.5%.
Formula · (Unique buyers credited to the email ÷ Delivered emails) × 100
Some reports divide by the number of people who clicked, so check which figure you’re using before comparing campaigns. Review which email offers generate the highest conversion rates to understand what encourages subscribers to complete their purchases.
3. Revenue Per Recipient (RPR)
RPR shows how much sales revenue your email earned per recipient, based on the orders credited to that send. If a campaign gets credit for $5,000 in sales from 10,000 deliveries, that works out to $0.50 per recipient.
Formula · Revenue credited to the email ÷ Delivered emails
Use it to compare campaigns sent to different numbers of people, then check what’s left after discounts and returns. A small campaign featuring a product refill may earn more per person than a sale sent to everyone.
4. Repeat Purchase Rate
This rate shows what share of customers who bought during a set period placed at least two orders. If 180 of your 600 customers bought twice or more during that period, your rate is 30%.
Formula · (Customers with two or more orders ÷ Customers who bought during the period) × 100
Give first-time buyers the same amount of time to reorder when comparing groups, and account for what they bought. A protein powder buyer may need a refill in a month, while a desk buyer may need care tips.
5. Customer Retention Rate
Retention shows what share of customers who were active at the start of a period stayed active through the end. Define what counts as active around how often customers normally buy, then stick with that definition across reports.
Formula · (Starting customers still active at the end ÷ Active customers at the start) × 100
If 400 of your 500 starting customers are still active at the end, your retention rate is 80%. If fewer customers return, check for late deliveries or product complaints before deciding what to send in your follow-up emails.
6. Customer Lifetime Value (CLV)
CLV estimates how much revenue a customer will bring in over the time they buy from your store. A customer who spends $50 per order and buys three times a year for two years generates $300 in revenue.
Formula · Average order value × Average orders per customer per year × Expected years as a customer
Check what’s left after costs before using this estimate to decide how much to spend on attracting new buyers. Identify your most valuable customer groups and develop exclusive offers that encourage them to continue shopping with you.
7. Purchase Frequency
Purchase frequency shows how often people who bought from your store placed an order during a set period. If 800 customers place 1,200 orders in a quarter, they average 1.5 orders per buyer for that quarter.
Formula · Total orders ÷ Unique buyers during the same period
Check buying patterns by product, since a bag of pet food usually needs replacing sooner than a suitcase. Use past orders and pack sizes to send refill reminders when customers are likely to run out.
8. Cart Abandonment Rate
This rate shows what share of shopping carts go without a purchase by the end of your tracking window. If shoppers create 1,000 carts and complete 320 orders from those carts, the abandonment rate is 68%.
Formula · [(Unique carts created − Carts that led to a purchase) ÷ Unique carts created] × 100
Baymard’s checkout research points to extra costs and long checkouts as two reasons shoppers leave before they pay. Send shoppers back to their saved carts and answer common shipping or return questions before offering a discount.
9. Email Unsubscribe Rate
This rate shows what share of people who received an email left your mailing list after that send. If 36 people unsubscribe after you deliver 12,000 emails, the unsubscribe rate for that send is 0.3%.
Formula · (Unsubscribes credited to the send ÷ Delivered emails) × 100
If more people leave, check whether your emails match the topics and frequency you promised at signup. Let subscribers choose what they receive, then watch clicks, orders, and spam complaints to see how they respond.
10. Customer Reactivation Rate
This rate shows what share of inactive customers you targeted placed another order within the time you set. If 24 of 600 customers buy again within 30 days of your win-back email, the rate is 4%.
Formula · (Targeted inactive customers who bought again within the set period ÷ Targeted inactive customers) × 100
Choose when to send the email based on the customer’s normal buying schedule, and feature something they have bought before. Compare orders with a similar group that received no email to estimate how many purchases the message added.
Which Customer Engagement Metrics Should Ecommerce Brands Prioritize?
Start with the issue costing your store orders or repeat business, then choose two or three measures to investigate. If you are deciding how to measure customer engagement across teams, give each number a clear owner and review date.
Business problem | Metrics to prioritize |
Email subscribers click but rarely buy | Email CTR, order conversion, RPR |
First-time customers do not return | Repeat buyer share, retention rate |
Revenue from existing customers is declining | CLV, orders per buyer |
Customers abandon their shopping carts | Cart abandonment, order conversion from email |
Subscribers are losing interest | Email CTR, unsubscribe rate |
Inactive customers are not returning | Reactivation rate, retention rate |
When you get about the same number of clicks, but orders fall, check the featured products, product pages, and checkout on your phone. If clicks and orders both drop and more people unsubscribe, review who gets your emails and how often. If regular buyers keep ordering but fewer first-time buyers return, check their delivery experience and what you send after purchase.
How Email Marketing Improves Customer Engagement
Once the numbers show where shoppers get stuck, build the email around a decision they still need to make. The examples below connect campaign and automation changes to results you can check after customers have time to respond.
Segment Customers Based on Purchase Behavior
Start with three groups you can recognize in your order history, including first-time customers, repeat buyers, and inactive buyers. Use purchased products, spending, and recent clicks to split groups further when shoppers would benefit from different messages.
- First orders: Share tips for using the product, then suggest something that goes with it.
- Regular buyers: Share new products from categories they already shop and items that match past orders.
- Inactive buyers: Use their last order to choose a product update, replacement reminder, or offer.
Compare clicks, purchases, and later orders across similar groups using this klaviyo segmentation guide to set up your first audience.
Build Automated Email Flows for Every Customer Stage
Set up automated emails around actions customers take, so useful messages can go out when the context is still fresh.
- Welcome emails: Show how the product helps and let new subscribers choose what interests them.
- Browse follow-up: Answer a common buying question and link back to the product they viewed.
- Purchase follow-up: Share setup or care tips, then send a refill reminder when customers need more.
- Win-back emails: Reach out when customers are overdue and feature something related to their last order.
Give each flow a purchase or retention goal, then track the revenue credited per delivery alongside the share who ordered.
Recover Lost Sales With Abandoned Cart Emails
Send a reminder while the product is still relevant, and show the exact items and options the shopper chose. Include product reviews, helpful product details, and a direct checkout link to make completing the purchase easier.
Use this guide to klaviyo abandoned cart flows to connect the message with the right cart event in your store. Test an email that answers common questions, then compare its recovered orders and margin with a version offering a discount.
Increase Repeat Purchases With Personalized Campaigns
Recommend items that work with what the customer already bought, such as refills that fit the specific dispenser they own. Reward regular buyers with exclusive product bundles, early access to new collections, or offers based on previous purchases.
Offer loyal customers something they can use, such as advance notice when their usual size comes back into stock. Compare second orders, orders per buyer, and longer-term spending across customers with similar purchasing histories to judge the effect.
Re-Engage Inactive Customers With Win-Back Emails
Create separate win-back campaigns for recently inactive customers and those who have not purchased for several months. Show people a relevant product update or offer that addresses a reason they might have had for staying away.
For example, tell buyers their usual coffee blend is available again if stock ran out around their expected reorder date. Track orders within a set window and check whether the people who clicked are also the ones who purchased.
Use A/B Testing to Improve Email Engagement
Pick a business outcome before testing subject lines, offers, buttons, email content, timing, or the number of messages you send. If the goal is more orders, two versions that sell equally well give you little reason to favor more clicks.
Change one meaningful element at a time and read conversions and revenue alongside clicks when the buying window closes. Use the ecommerce email A/B testing guide to plan a test and choose a measure tied to the change.
How to Track Customer Engagement With Email Marketing Tools
Your email tool can show who clicks campaigns and automated emails, and which orders it credits to those messages. Before comparing email marketing performance metrics, check that your reports use the same dates and rules for counting orders.
- Store connection: Place a test order and check that the customer and order total appear.
- Report settings: Save your report filters so your team can check the same numbers later.
- Order matching: Check whether guest and signed-in orders using the same email share one profile.
Klaviyo
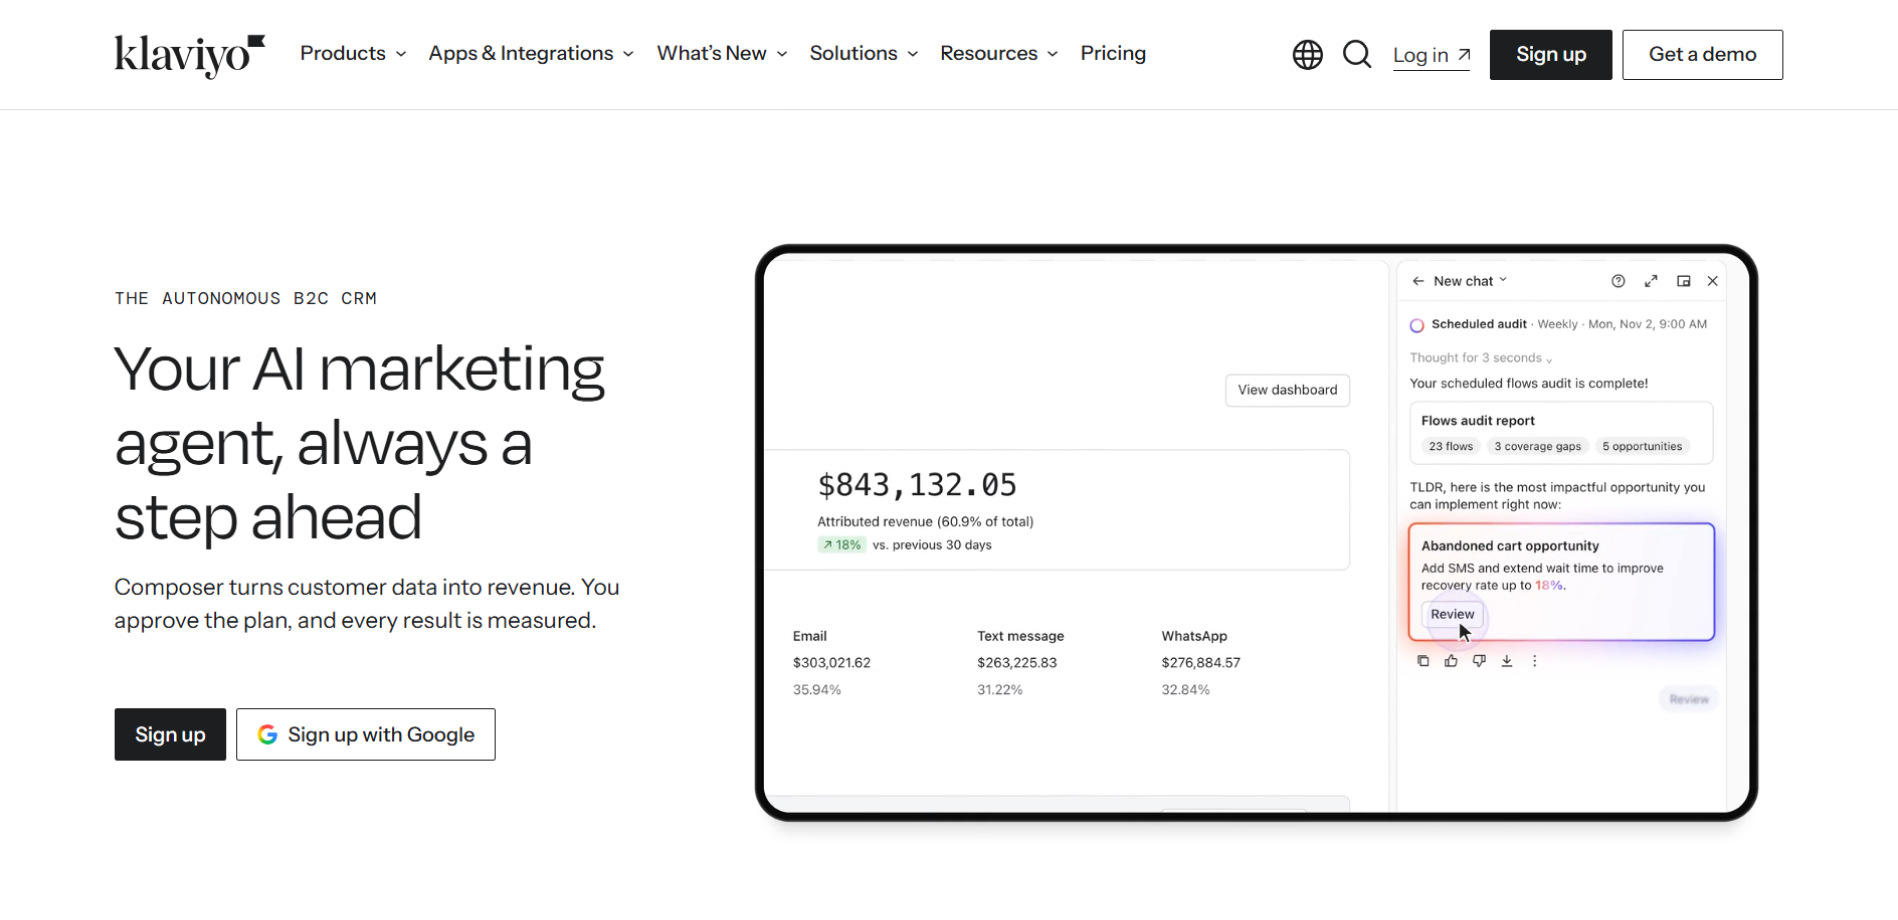
Klaviyo’s campaign reports show clicks, conversions, and revenue per recipient for each send. Once your store is connected, use the same rules for crediting orders when comparing campaigns and automated emails. Our Klaviyo audit checklist shows which campaign, flow, and reporting settings to review.
Mailchimp
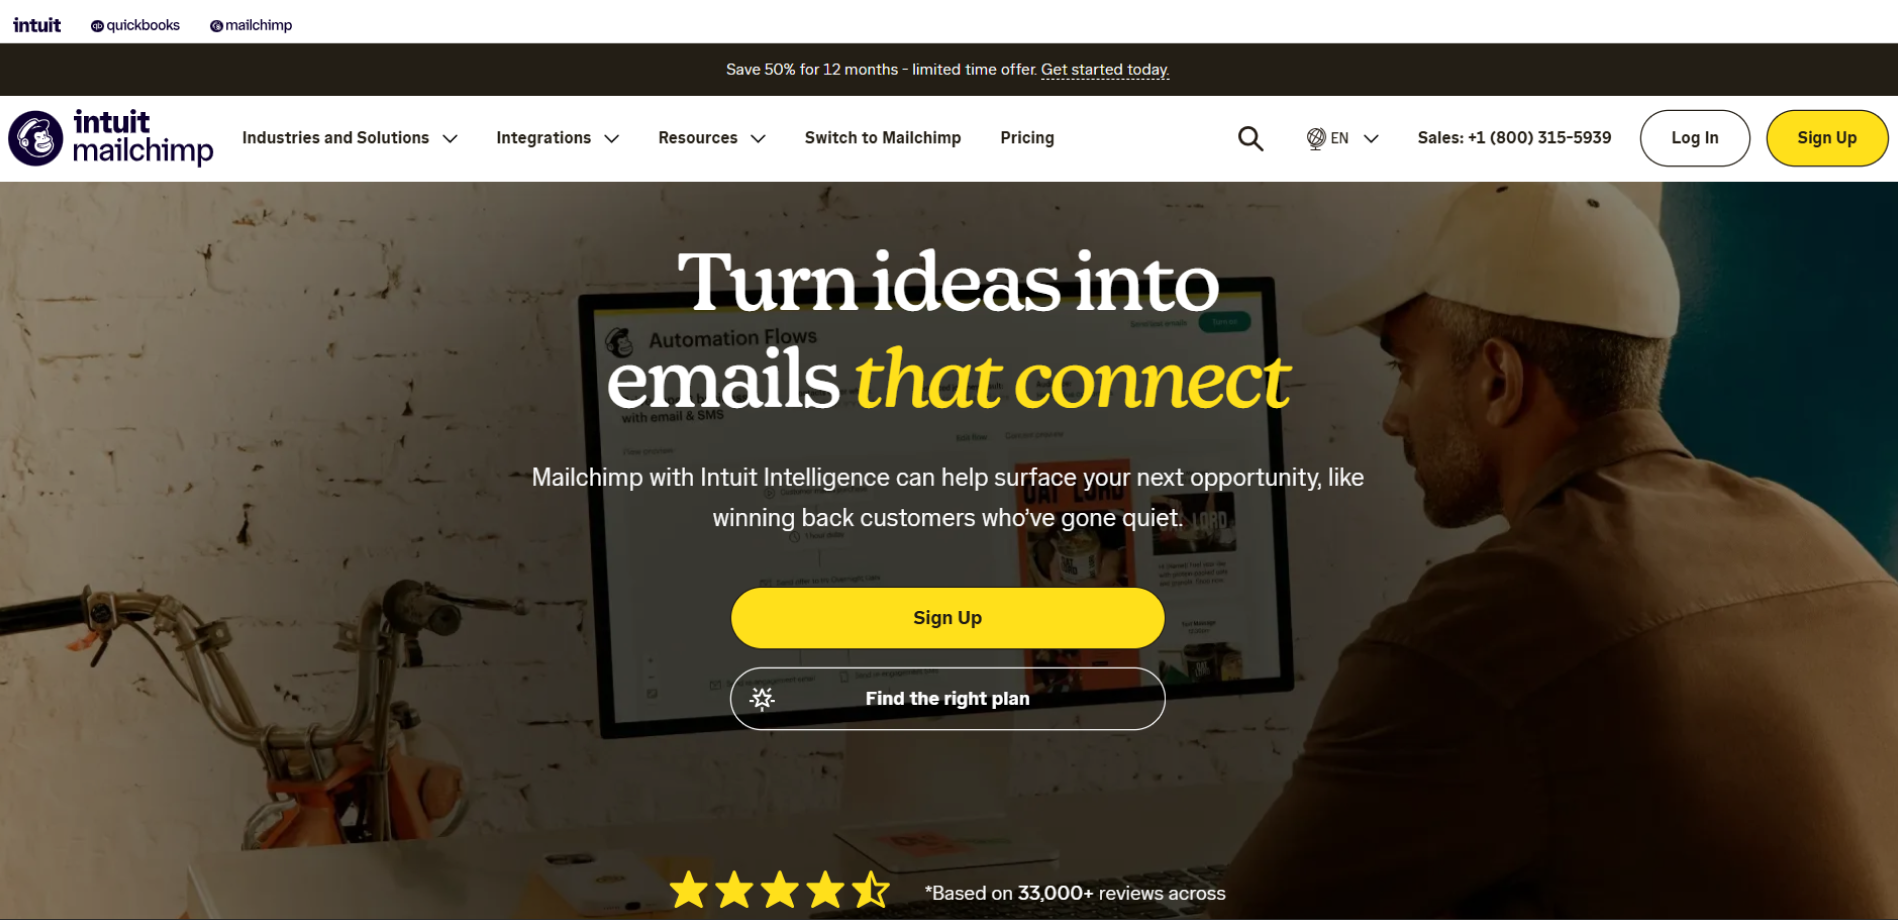
Use Mailchimp’s email reports to see which links people clicked and how many subscribers left after a campaign. With a supported store connected and ecommerce tracking turned on, you can also see purchases credited to your emails. Our Klaviyo vs Mailchimp comparison explains how the two platforms differ in reporting, automation, and store connections.
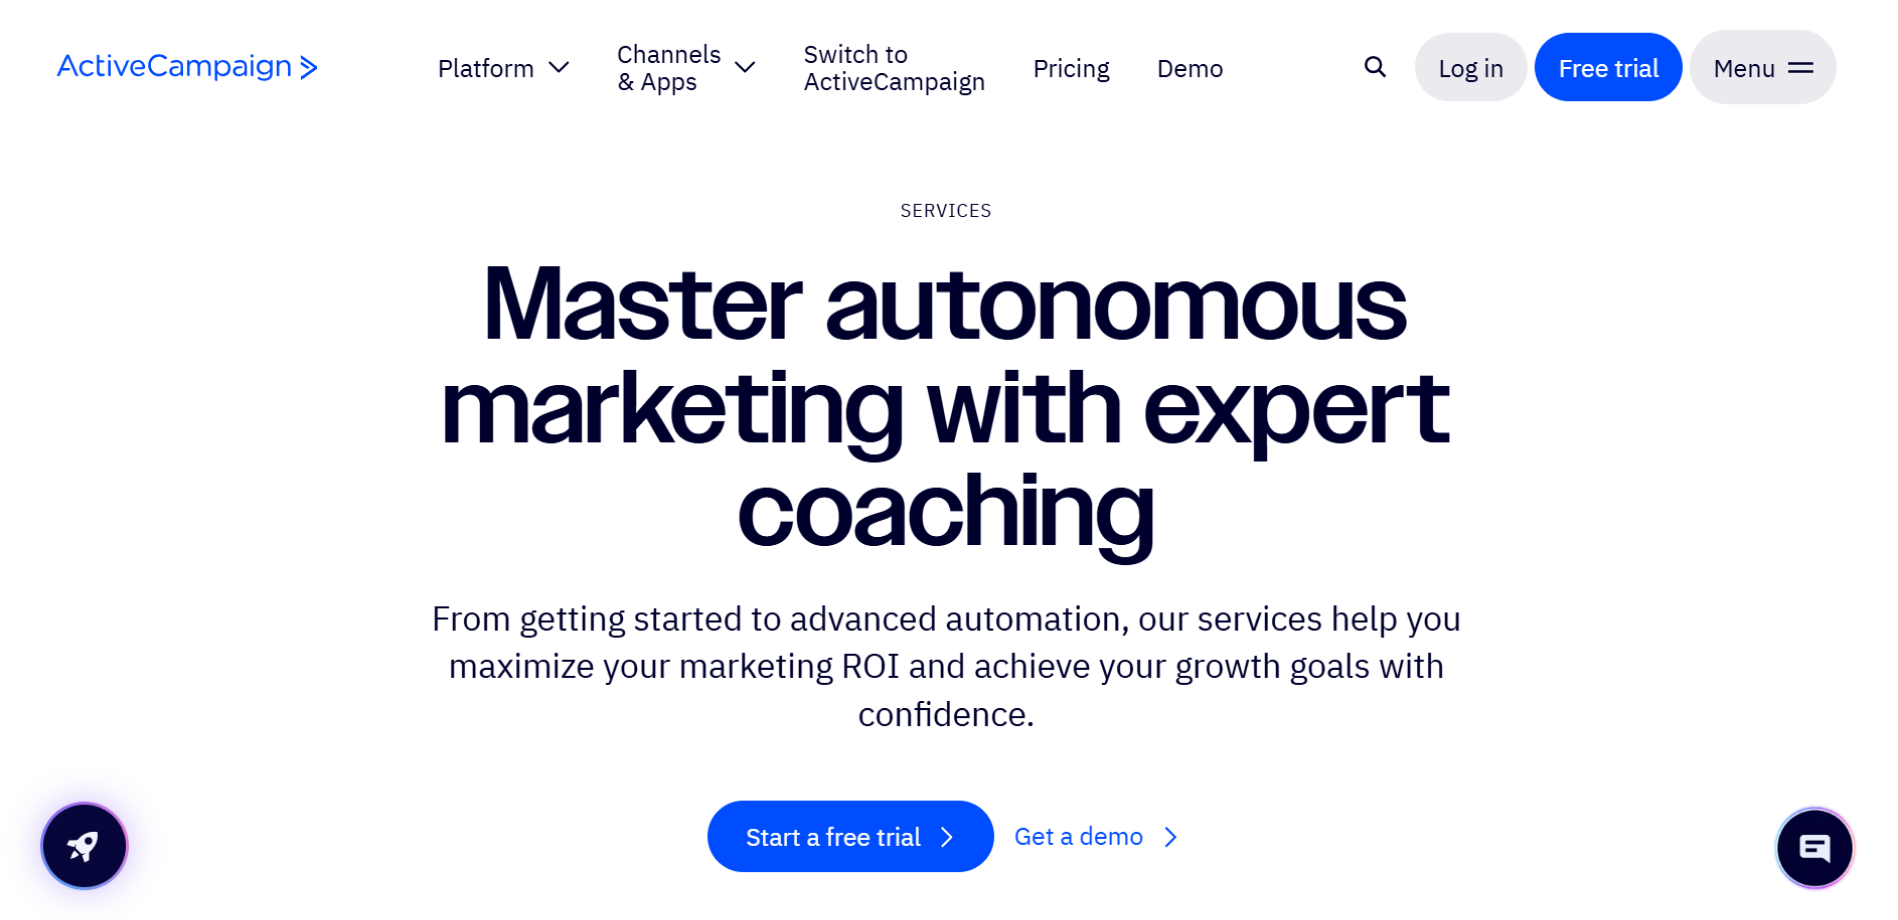
ActiveCampaign
ActiveCampaign’s reports show how campaigns and automated emails perform, including sales credited to emails when a supported store is connected. Check contact activity alongside orders to see how buyers responded at different points in an email series. Our ActiveCampaign vs Klaviyo comparison covers how the two tools handle automation, reporting, and ecommerce data.
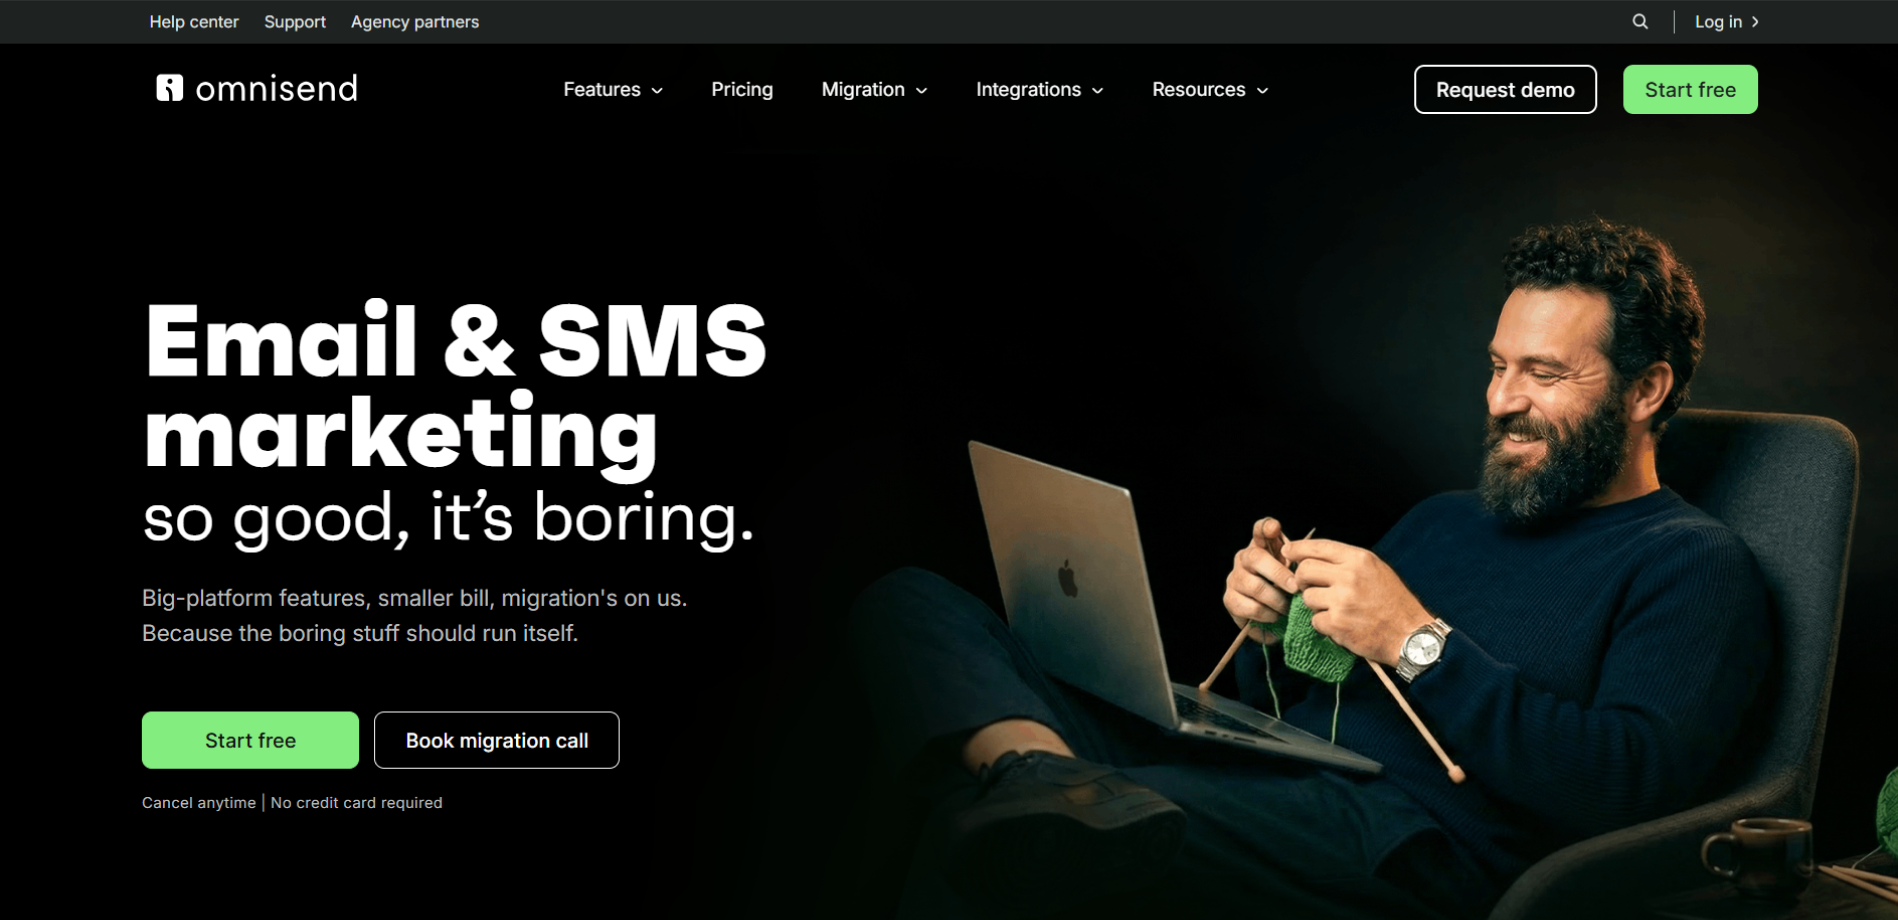
Omnisend
Omnisend’s reports show clicks, orders, and sales credited to campaigns and automated messages. Review one-time campaigns and automated reminders separately, since each can reach shoppers at a different stage. Our Klaviyo vs Omnisend comparison explains how both platforms handle reporting, customer groups, and automated emails.
Conclusion
Tracking the right customer engagement metrics helps ecommerce businesses understand what drives purchases and builds lasting customer relationships. These insights can guide your marketing decisions, reduce wasted spending, and uncover opportunities to increase revenue from existing customers.
The real value of these metrics comes from using them to improve your campaigns, rather than simply reviewing reports. Regular tracking helps you identify which marketing activities deserve more investment and which need further improvement.
At IR Solutions, our email marketing services help ecommerce brands turn customer data into targeted campaigns, personalized emails, and effective automated flows. We help businesses improve customer engagement, encourage repeat purchases, and achieve measurable revenue growth through email strategies built around their customers' needs and long-term business goals.
Frequently Asked Questions
What Are the Most Important Customer Engagement Metrics?
Start with email clicks, order conversions, and the share of buyers who return within your store's typical buying window. Together, those figures show who took an interest in your message, who bought, and whether buyers came back later. Track abandoned carts if checkout loses shoppers, or measure reactivation if past customers are overdue for another order.
How Do You Measure Customer Engagement in Email Marketing?
Pull delivered messages, unique clickers, attributed orders, and unsubscribes from the same campaign report for the time period you chose. For recipient-based email engagement metrics, compare each action count with the number of deliveries and state the denominator clearly. Check the store report for the actual orders and use your email platform to see which campaigns received credit.
What Is a Good Email Engagement Rate?
A good result improves against comparable campaigns while maintaining healthy sales and keeping complaints and unsubscribes within your usual range. Compare similar audiences and message types, because a refill reminder and a general newsletter reach people with different buying intentions. If clicks improve but revenue falls, review what people clicked and whether the email offered a clear reason to buy.
How Does Email Marketing Improve Customer Retention?
Email helps customers get more value from their purchase, remember when to reorder, and discover products that fit their needs. A care guide helps after delivery, while a restock message gives customers a reason to visit weeks later. Compare later orders among similar buyers to see whether those messages helped more of them return within the usual window.
Which Customer Engagement Metrics Affect Revenue?
Orders attributed to campaigns, revenue per delivery, repeat buyer share, and average ordering frequency are closely tied to sales. Read these figures alongside order value and margins, especially when a promotion changes how much each purchase contributes after discounts. Where possible, compare similar groups with and without the email to estimate how many extra orders the campaign generated.
How Often Should Ecommerce Brands Review Engagement Metrics?
Check campaign reports after the attribution window closes, and use a weekly review to spot changes across comparable sends. Assess retention and long-term buyer value over longer periods that give customers enough time to place their next order. Review your biggest product categories separately if customers buy each one on a different schedule throughout the year.